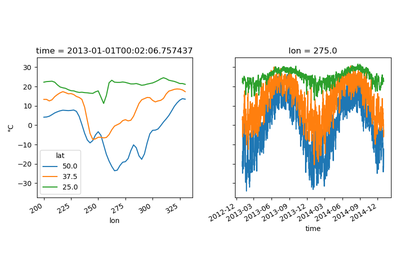
Multiple lines from a 2d DataArray
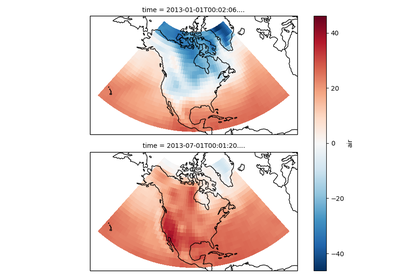
Multiple plots and map projections
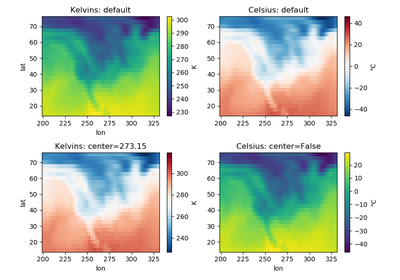
Centered colormaps
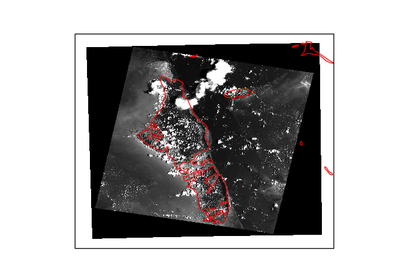
Parsing rasterio’s geocoordinates
Generated by Sphinx-Gallery